Make pino Log Messages Appear with the Correct Status in Datadog
If you’re using pino with
Datadog’s Log Management product, you might notice that all of your logs are
reported at the info level, regardless of what log level you’re using in your code.
Having all logs categorized as info-level messages makes it challenging to find what you’re looking for.
The Problem
By default, pino uses a numerical serialization to represent the level of the message.
For example, this code produces the following output:
import pino from "pino";
const logger = pino();logger.info("info message");logger.warn("warn message");
{ "level": 30, "msg": "info message", "time": 1603492511716, "pid": 66621, "hostname": "71b5c8be.local"}
{ "level": 40, "msg": "warn message", "time": 1603492511716, "pid": 66621, "hostname": "71b5c8be.local"}Datadog’s default Status Mapper does not understand how to convert these level numbers over to their string
representation (like info, warn.)
The Fix
Luckily, there’s a pretty easy fix for this problem. According to the
Status Remapper docs, we need to
report the log level as a string representation of the level vs. the
numbered defaults used by pino.
You’ll need to configure this in two places:
Pino Configuration
When creating your logger, use the
formatters configuration
to override the default level serialization. This will produce string output instead of the numerical representation.
Here’s the same code from before, with a level formatter.
import pino from "pino";
const logger = pino({  formatters: {    level(level) {      return { level };    },  },});
logger.info("info message");logger.warn("warn message");{"level":"info","msg":"info message","time":1603492741115,"pid":66835,"hostname":"71b5c8be.local"}{"level":"warn","msg":"warn message","time":1603492741115,"pid":66835,"hostname":"71b5c8be.local"}Datadog will be able to understand these new string representations of the log level after we configure the pipeline.
Datadog Pipeline
Next, we’ll set up a Log Pipeline with a Status Remapper Processor in your Datadog configuration.
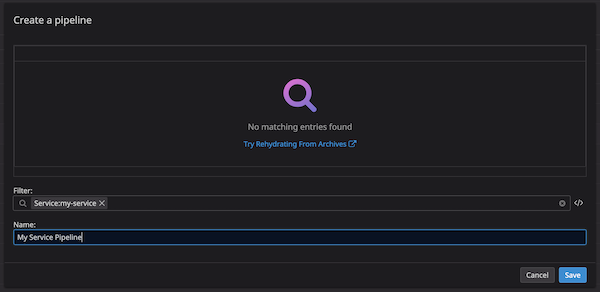
- View your Log Pipelines in Datadog
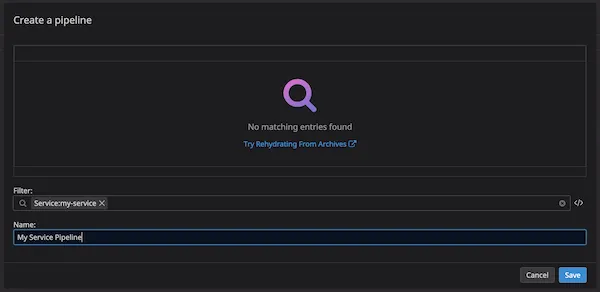
- Create a new pipeline for the service that uses Pino. You can skip this step if there’s already a pipeline created
for your service.
- Add a Status Remapper processor on the
levelattribute.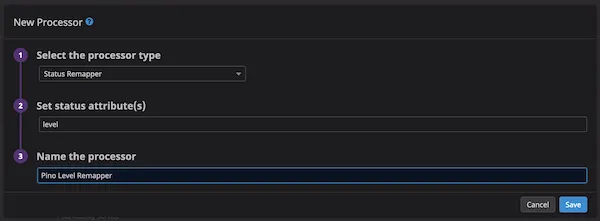
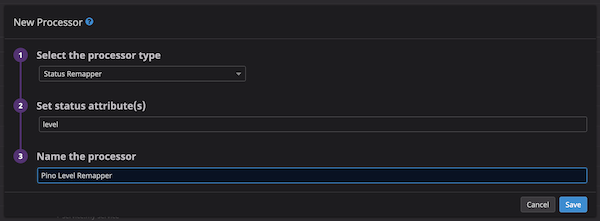
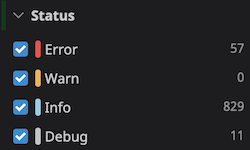
Now, new messages should appear with the proper status identified in the Datadog UI. Happy log spelunking!